


Base Charts

Here we will make a short overview in form of the content of the inbuilt thumbnail window; whose base charts are raw templates which you can use to modify based on. Of course, you can change the color and look in the properties at will. In addition, each chart template is an object based on a rectangle or round shape that can be changed via numerous base properties.
The following symbols can be selected by drag & drop into the evaluation page.
(The property text is set depending on the language settings - here in German)
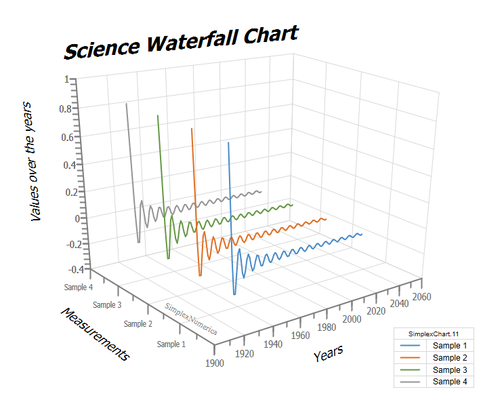
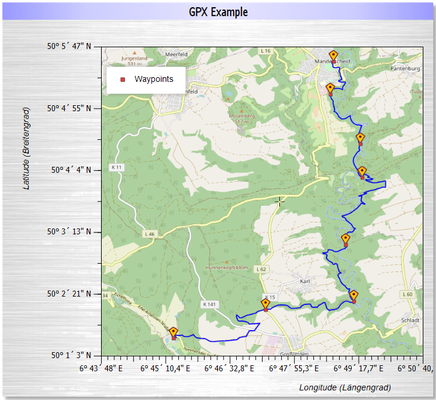
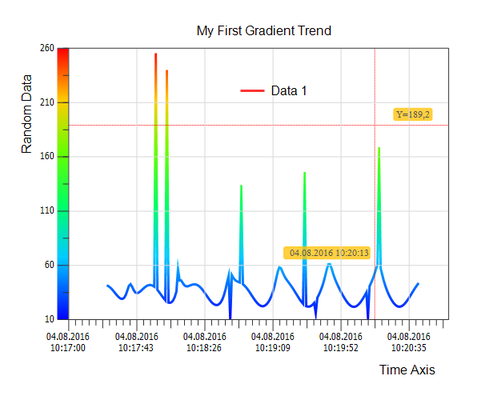
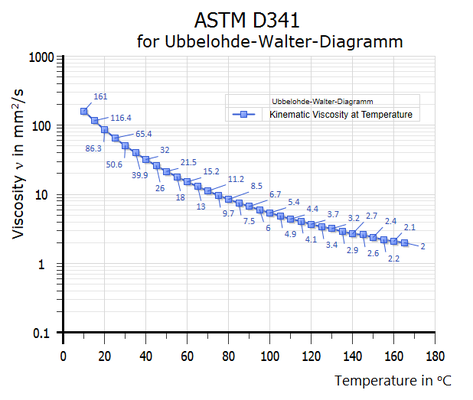
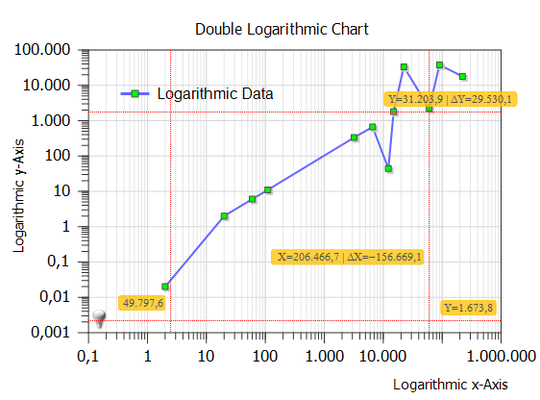
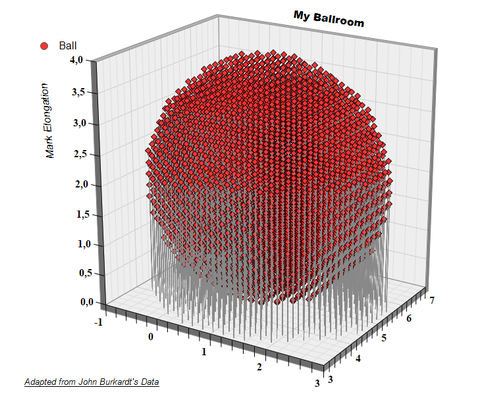
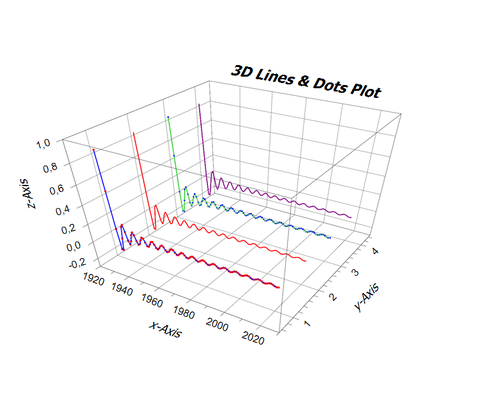
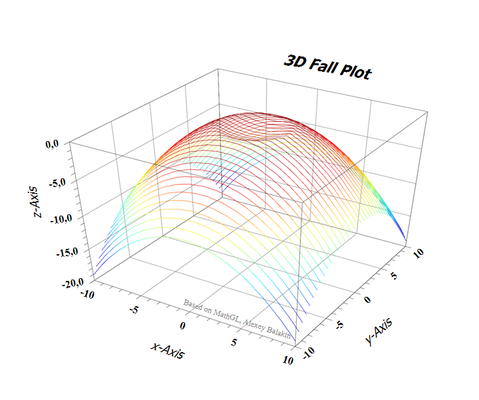
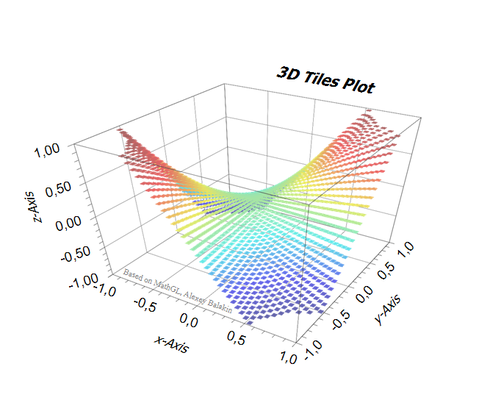
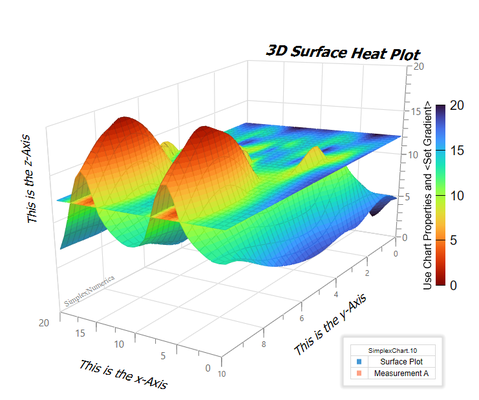
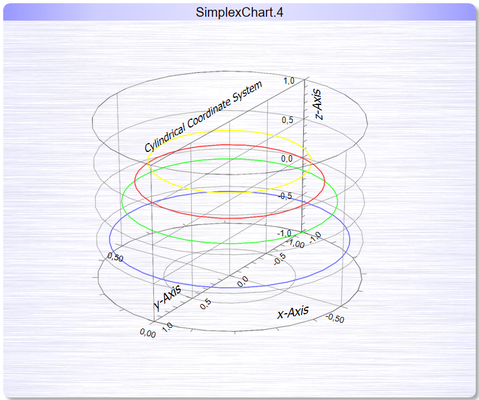
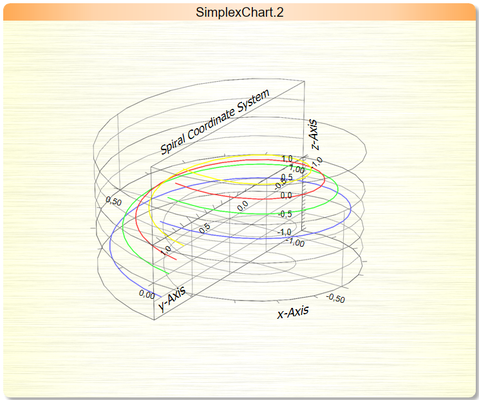
Science Plots


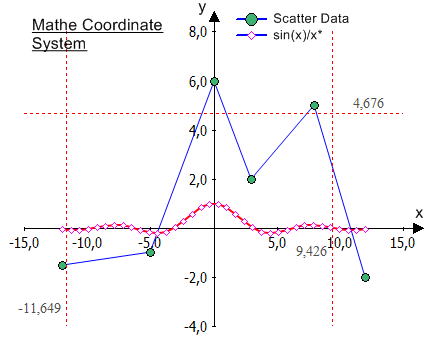


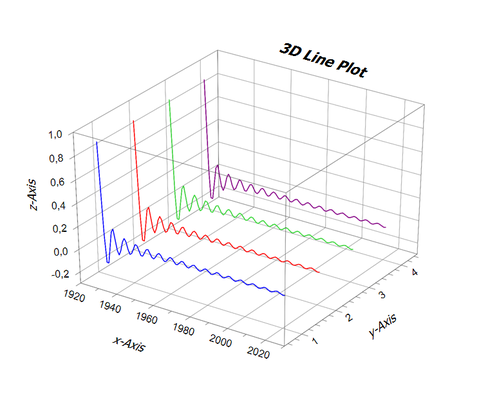
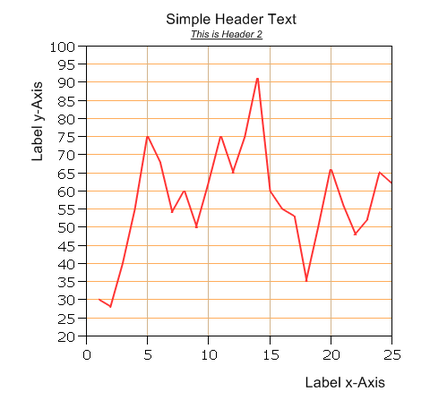
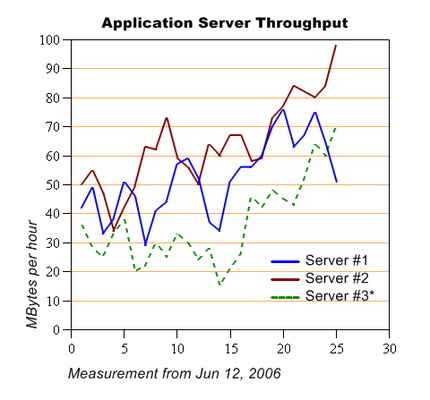
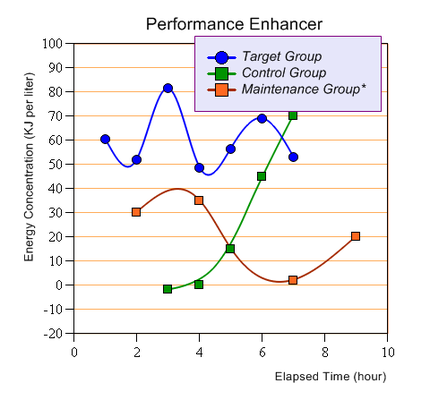
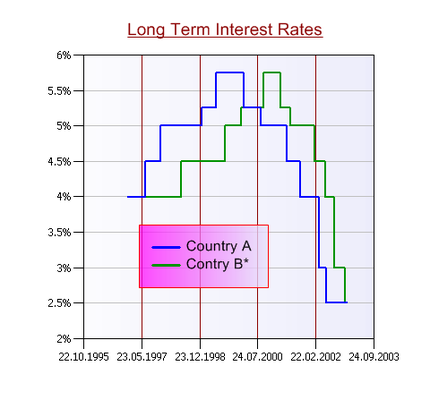
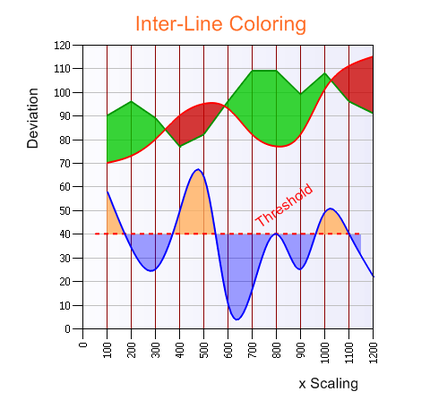
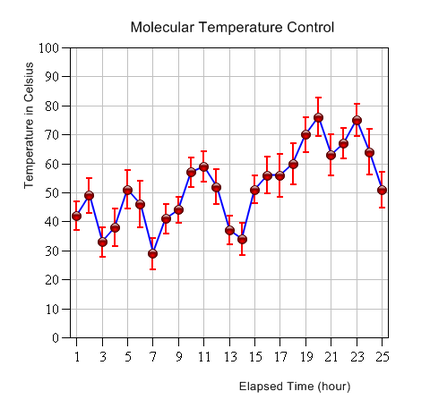
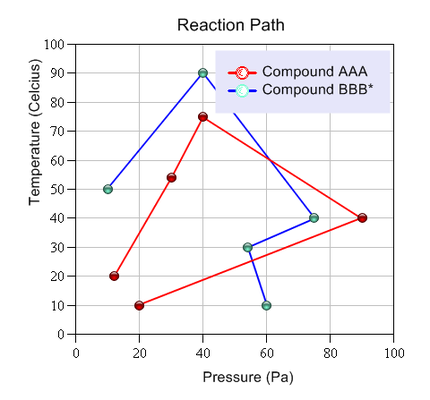
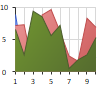
2D Line Charts


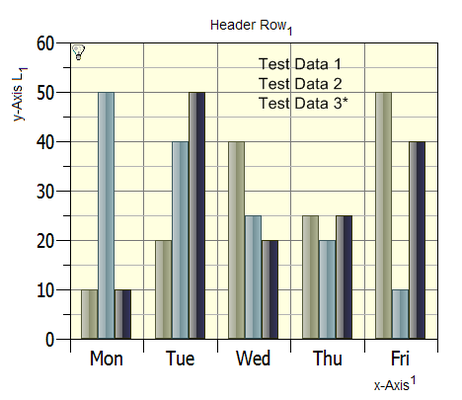
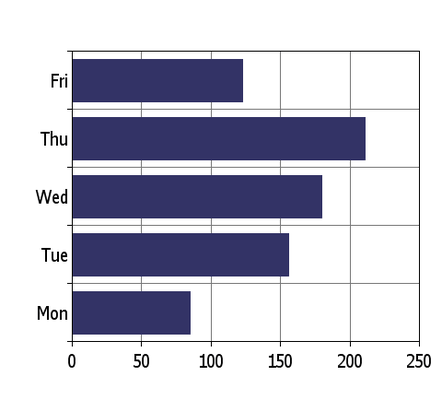
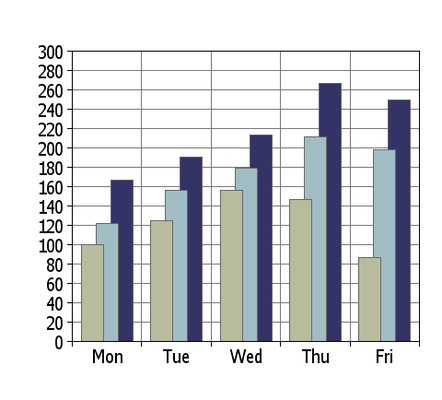
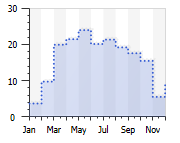
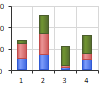
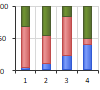
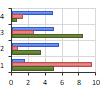
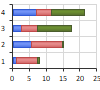
2D Bar Charts


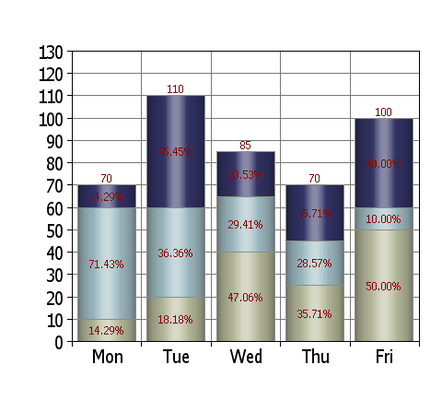


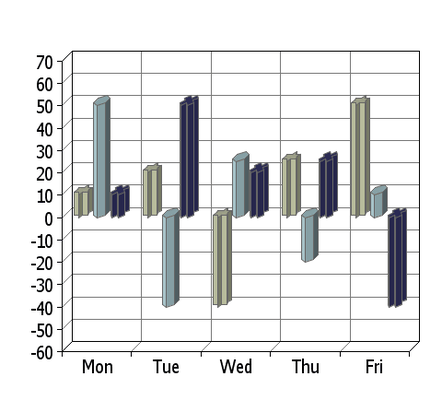
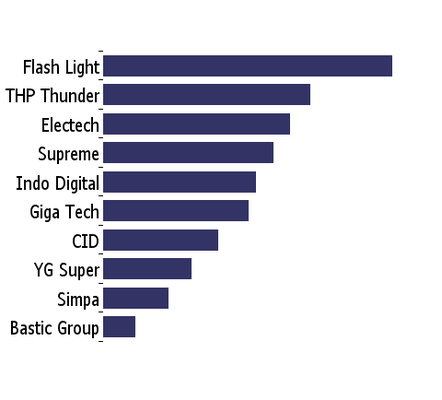
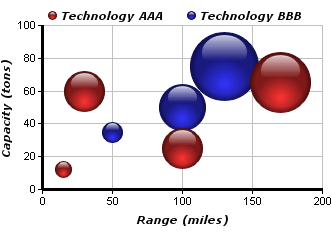
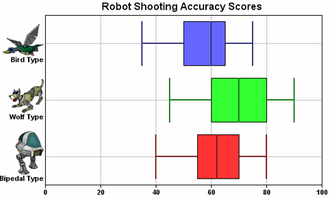
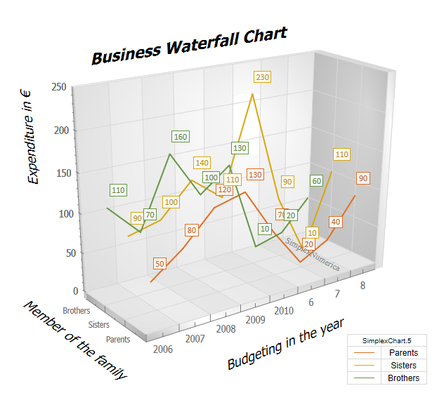
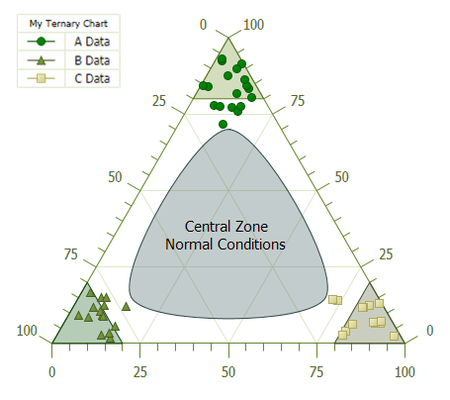
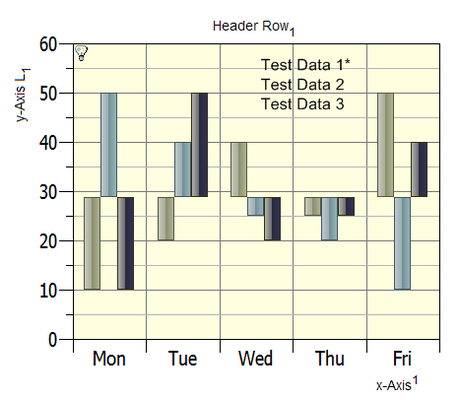
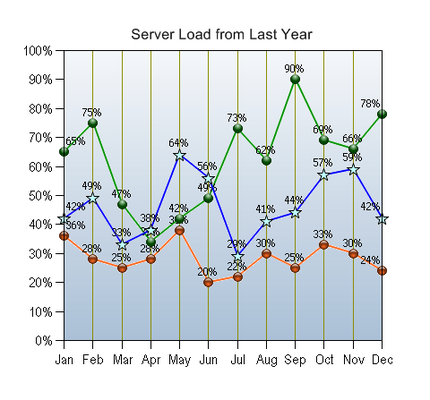
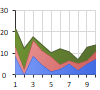
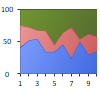
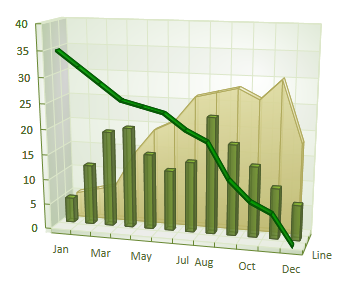
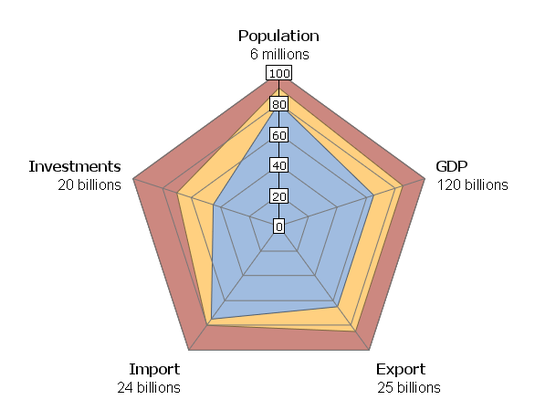
2D Business Charts


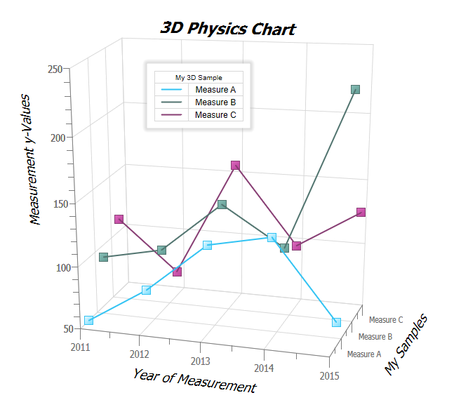
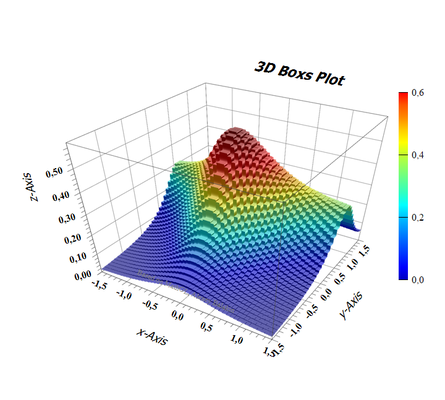
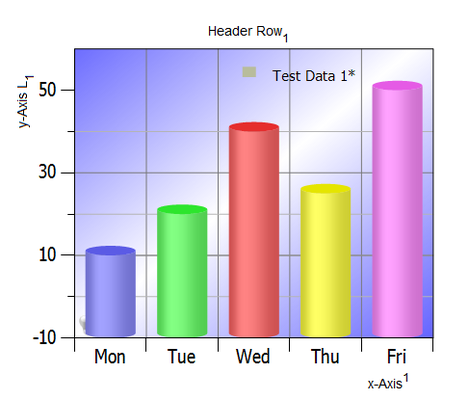
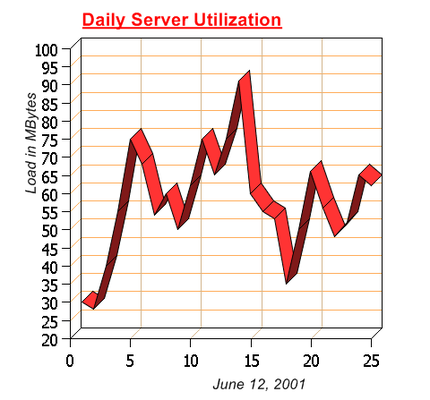
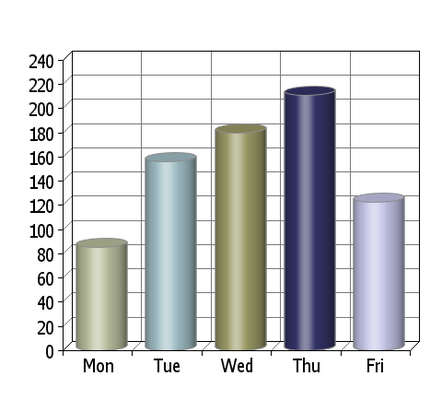
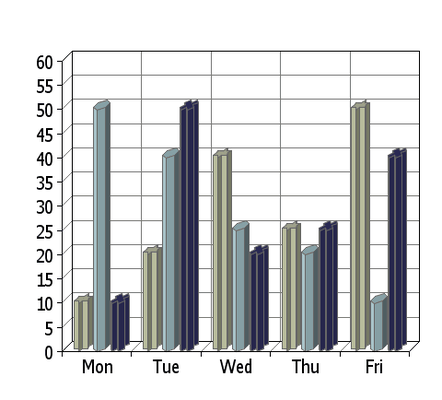
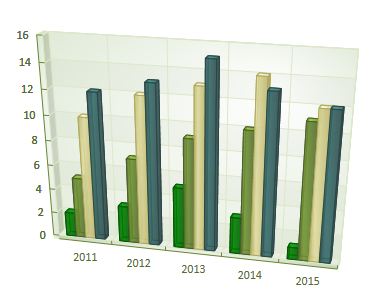
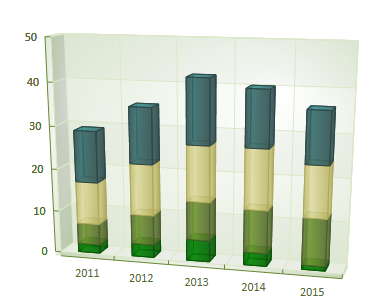
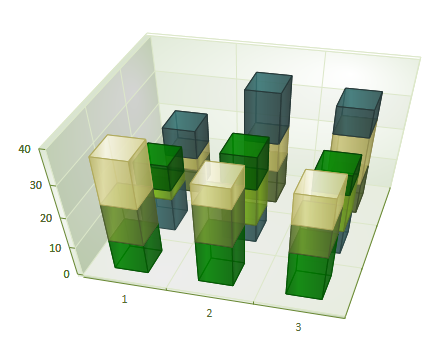
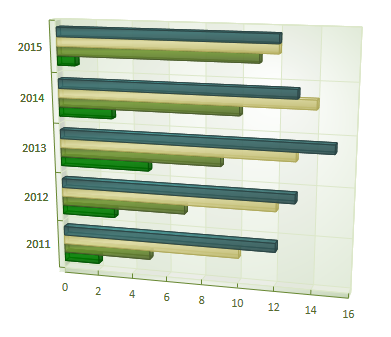
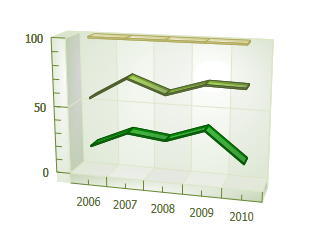
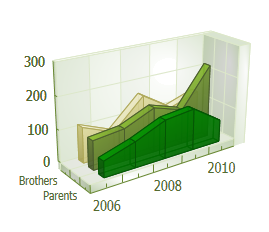
3D Business Charts


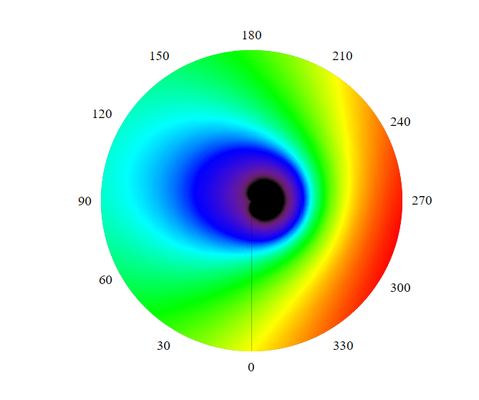
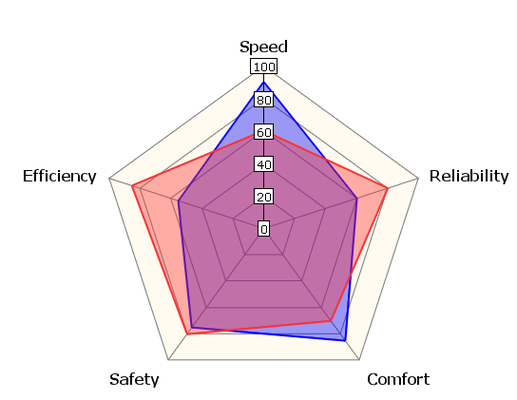
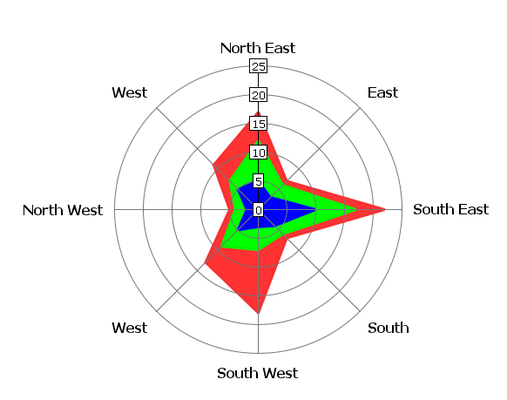
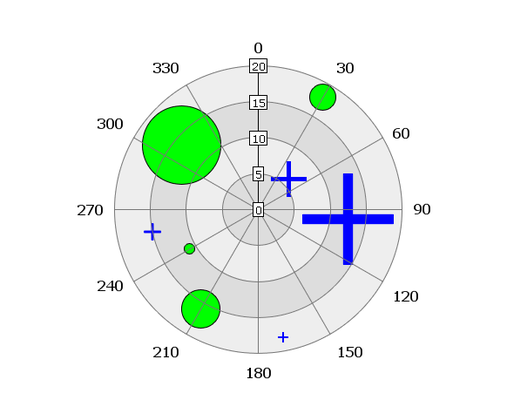
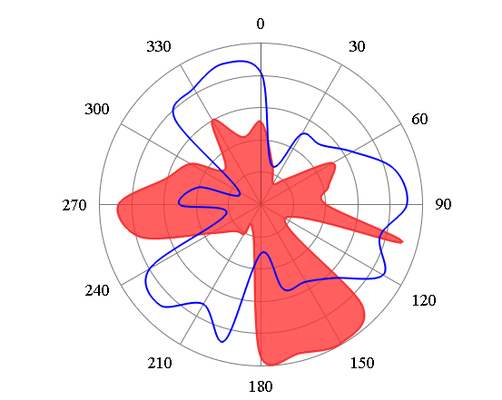
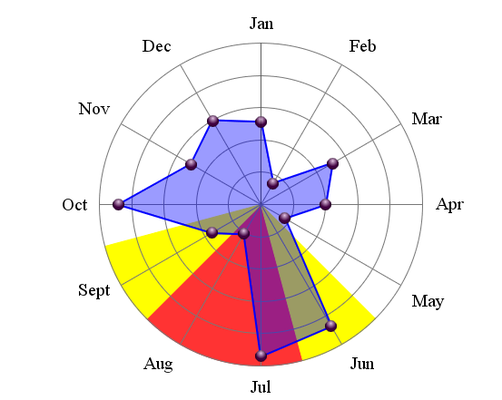
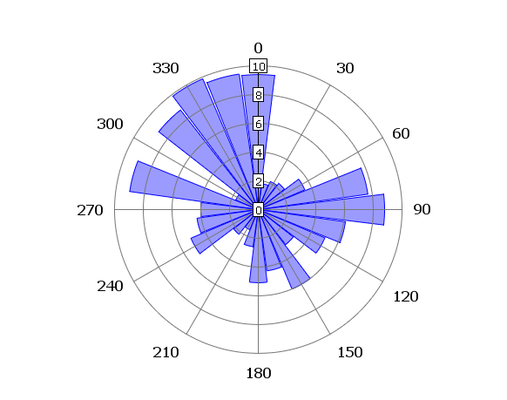
Polar Charts


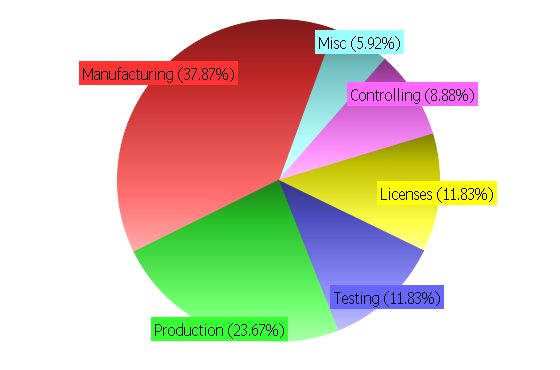
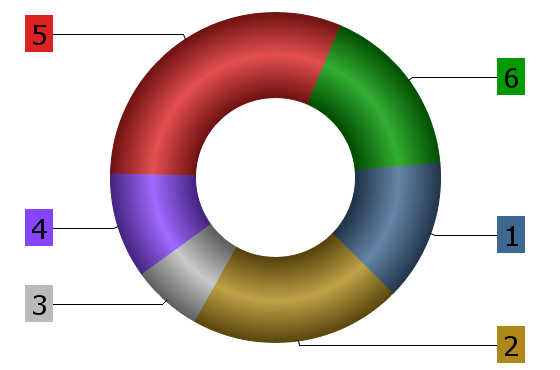
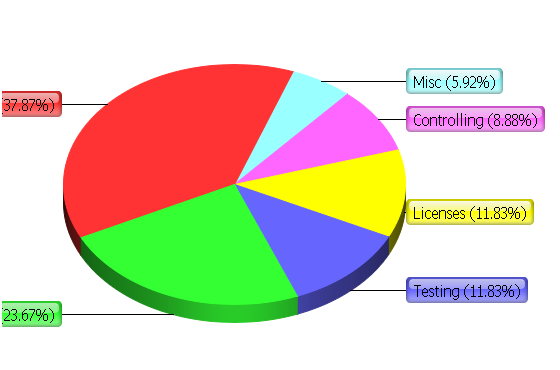
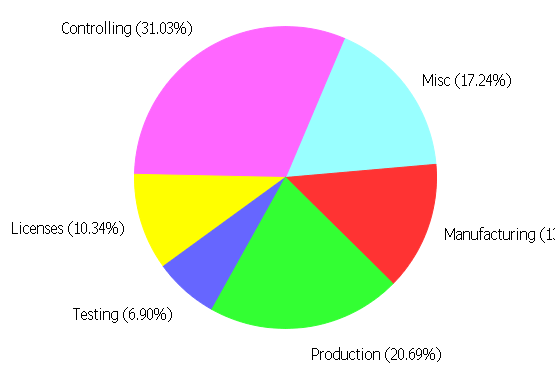
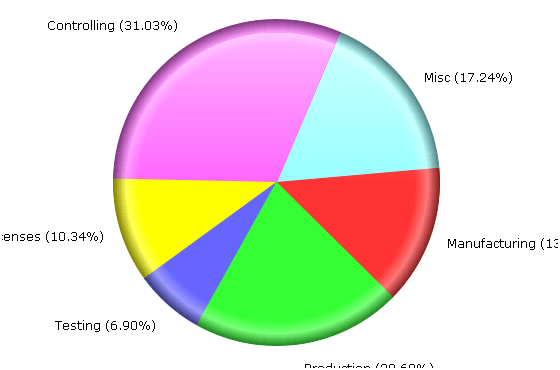
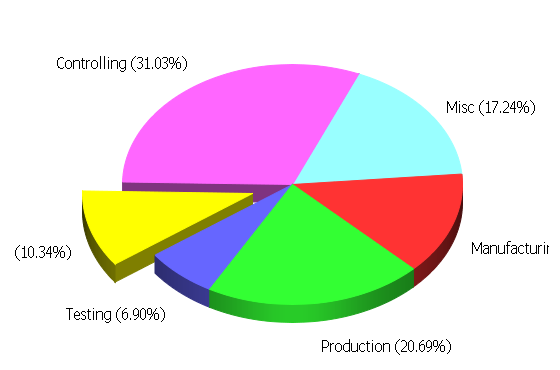
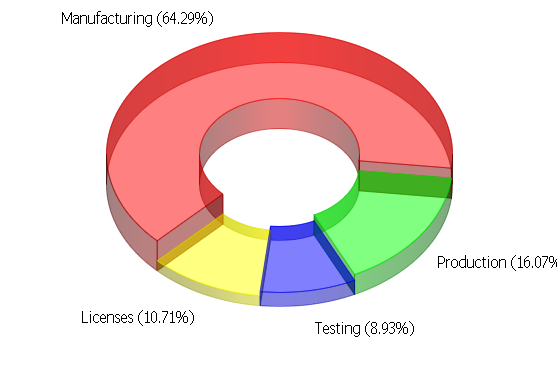
Pie Charts


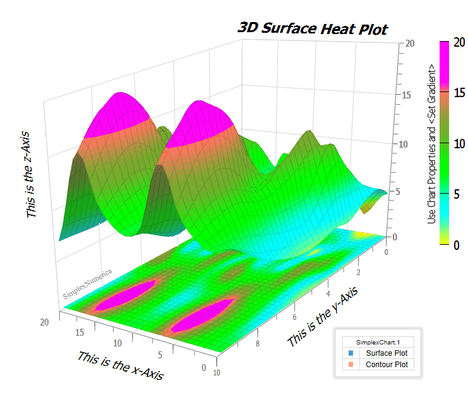
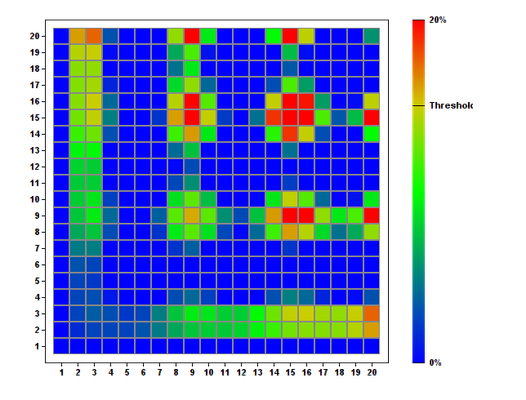
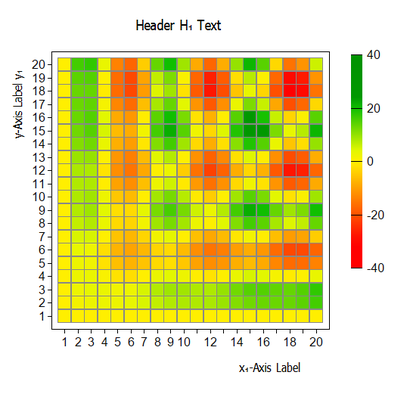
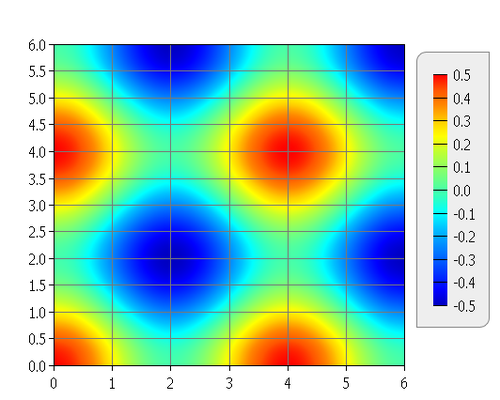
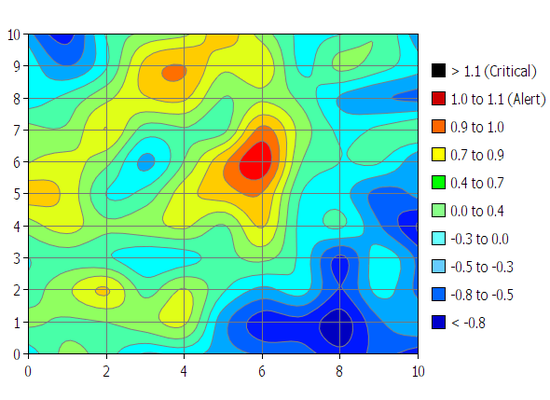
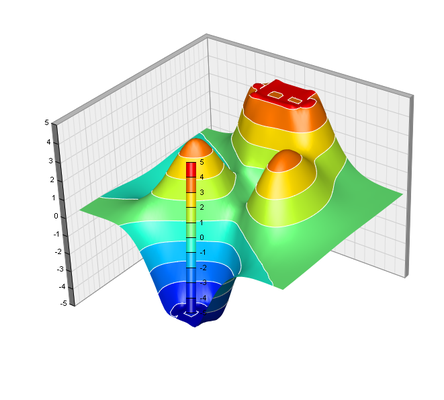
Contour Plots


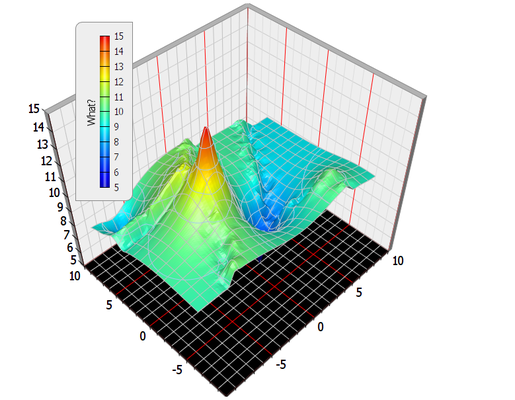
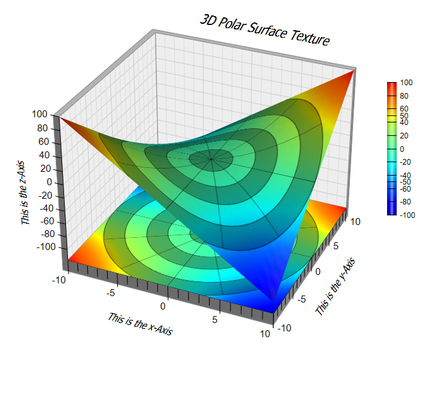
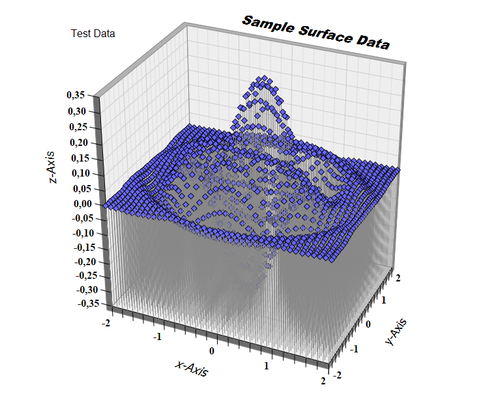
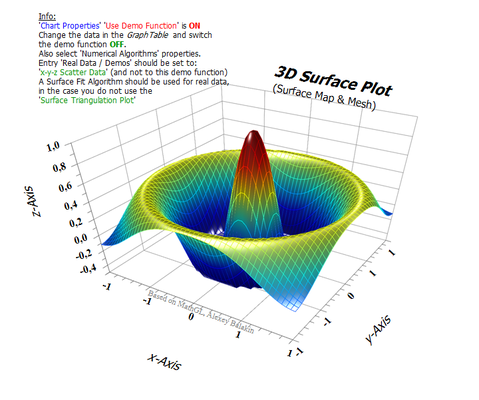
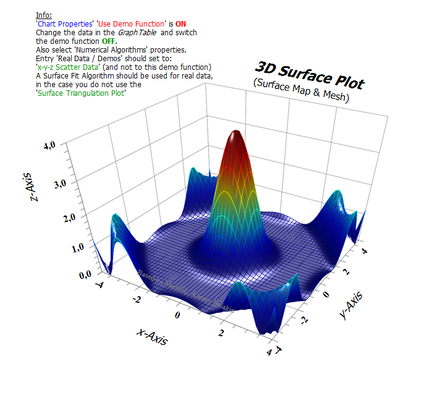
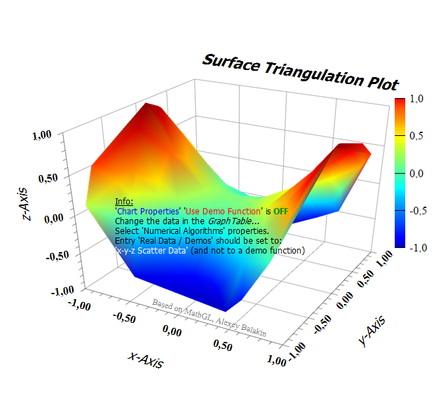
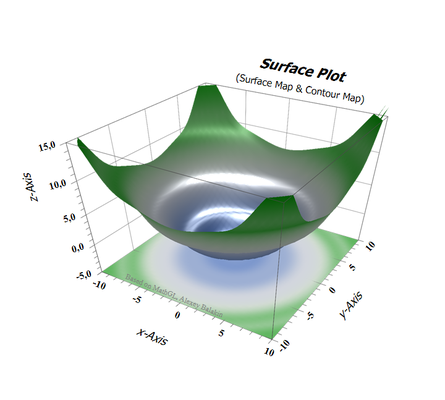
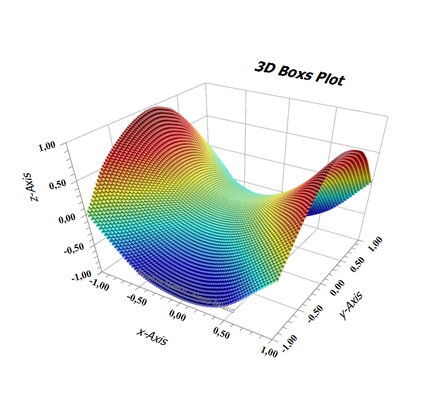
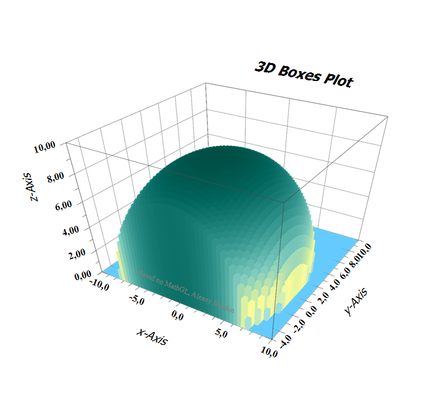
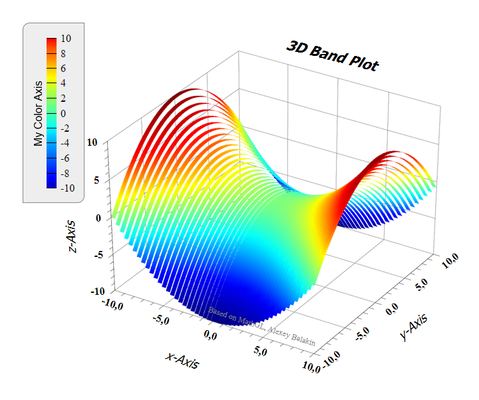
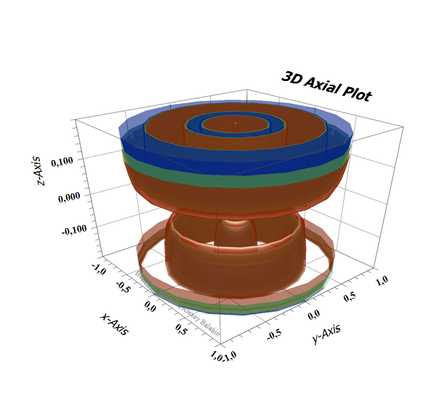
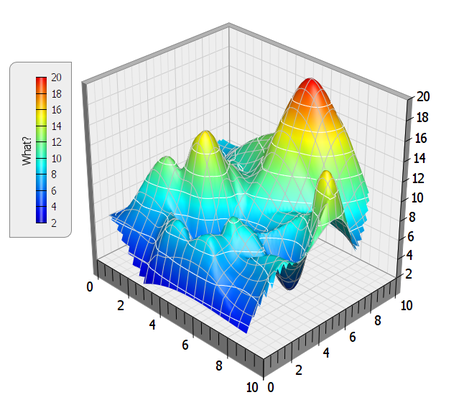
Surface Plots


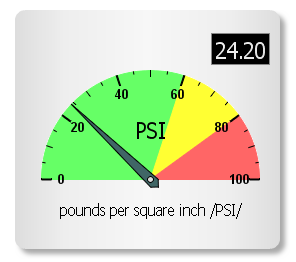
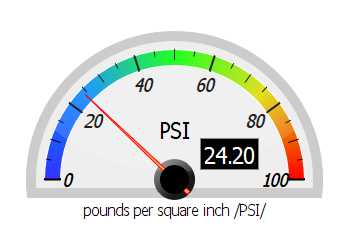
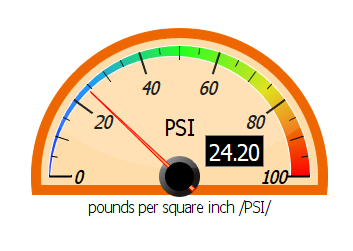
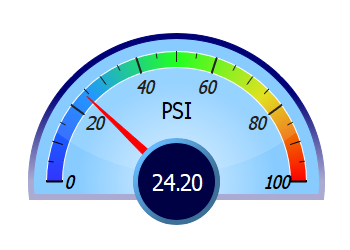
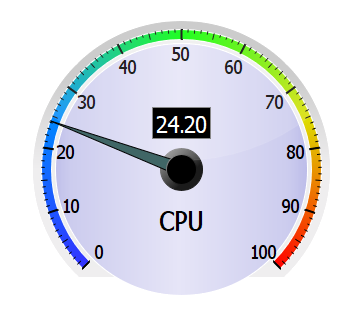
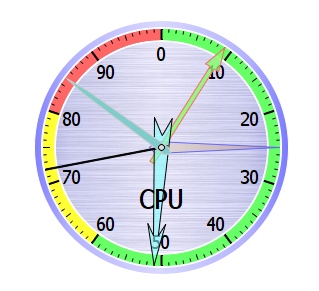
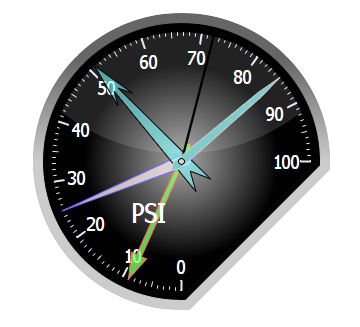
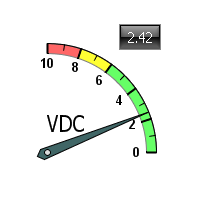
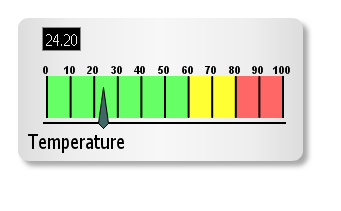
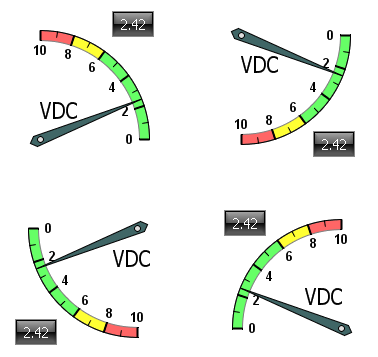
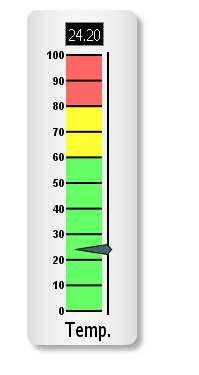
Meter & Gauges


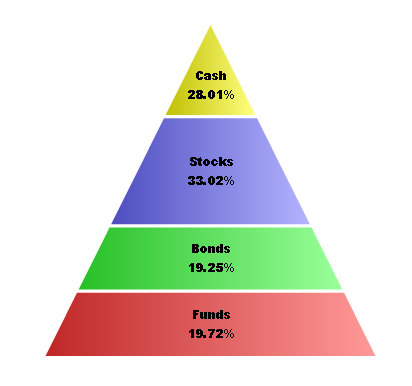
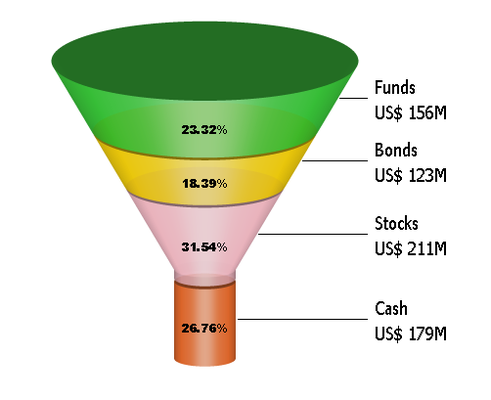
Pyramid, Cone & Funnel


The following chart types do not have inbuilt thumbnails, yet. But you can use the SimplexNumerica properties to set each individual afterimage and it's type characteristics, in the same way you could manipulate the inbuilt chart objects behind the thumbnails!