PLEASE CLICK ON THE TEXT TOOLBAR ABOVE THE BLACKBOARD PICTURE
SimplexNumerica is a data analysis tool that can plot graphs and charts with elegance. It can interpolate small and approximate large data numbers. It can also perform calculations and statistics in script form. SimplexNumerica is a powerful data visualizer and simulator. It can help you explore and discover the patterns and trends in your data. SimplexNumerica is easy to use and easy to customize. It has many features and options to tweak. It can export and import data in different formats. It can create reports and presentations with a great impact on your customers. SimplexNumerica is a software you should try. It can make your data analysis fun and easy. It can also increase your knowledge and creativity. It can solve your problems with simplicity.
Some features of SimplexNumerica:
- Base program development started in the year 1986 at Fraunhofer-Institut in Germany.
- Since then, a new class of technologies has been quietly in development.
- It has a new sophisticated rendering engine that produced astonishing graphics and layouts.
- It has an object-oriented user-interface based on a bunch of high level C++ classes.
- It has an Inter-Process Control Interface (IPC) for Client/Server structure.
- It offers you an integrated environment for data analysis and visualization.
- You can analyze data with a broad range of computing and numerical methods on a Microsoft Office like interface.
- You can visualize the results as professional rendered charts and graphs.
- A spread view dedicated for each chart contains Excel-compatible spreadsheets.
- It provides a wide range of computing methods such as mathematical Approximation and Interpolation algorithm.
- Based on SimplexGraphics & ChartDirector.
- It is a high-end product that works best for you!
Advantages of Simplex Numerica
If you are a student, physics, engineer or scientist and you are dealing with complicated numerical mathematics or a lot of measuring data, then SimplexNumerica is the powerful, intuitive software for analysing and presenting your solution. SimplexNumerica enhanced all your needs and helps you to evaluate and visualize your data.
- It provides a powerful Microsoft Office 2016 like computing environment for engineering and scientific applications.
- It centralized your data and algorithms.
- It includes hundreds of mathematical functions.
- It has a high level C++ programming language (AngelScript) which allows access to advanced data structures, 2-D and 3-D graphical functions.
- It includes a large number of algorithm.
- It imports measured data in all popular formats.
- It has enhanced database import.
- Simply use the Microsoft Excel Import / Export.
- It can use analyses automatically on any number of measurements.
- You can share your (encrypted) evaluations or templates with other users over the internet or internal LAN (your intranet).
- Multiple chart types can be combined using layers.
Cursor Functions

You can evaluate your data interactively with the powerful cursor tools as you can see on the left picture. You can see immediately what you have measured and extract key information from your data without having to make calculations.
In addition you can use the inbuilt statistic window with all the common standard statictics necessary for your evaluation.
Report Module with Database Import
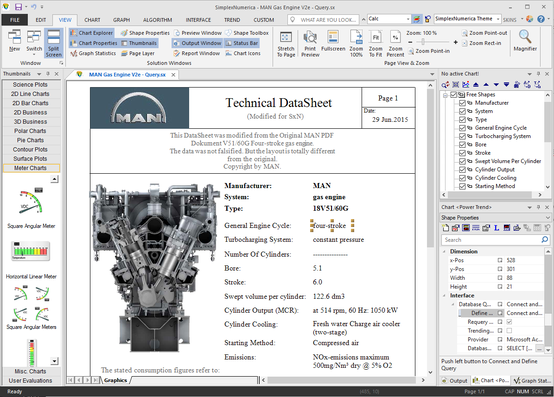
Is it possible to import from my database straight away into the coordinate systems, charts and shapes without a detour as in some other programs?
Yes, you can import data directly from a Client database like Microsoft Access or a Server database like Microsoft SQL Server or Oracle direct into SimplexNumerica (with the help of a comfortable inbuilt wizard).
The picture to the right shows a report that was generated immediately from a SQL Server database. You can also trending data and refreshing database data in all available charts.
Microsoft Excel Import / Export
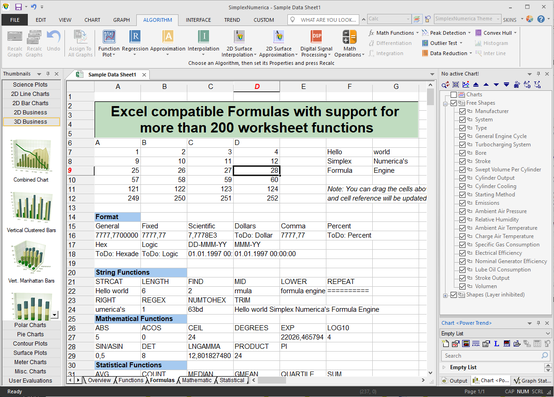
Like Excel, the inbuilt spreadsheet in SimplexNumerica can perform formula-based calculations and many other mathematical functions. It has inbuilt algorithm (like FFT) that can be used directly in the spreadsheet, too. The results can be saved (exported) in an Excel file (*.xls or *.xlsx).
You can also import your data directly from an Excel file (*.xls or *.xlsx) into a similar SimplexNumerica spreadsheet. The Import Wizard examines the Excel file (or text file, like *.CSV) that you are importing and helps you ensure that the data is imported in the way that you want.
built-in Scripting Engine (angelscript)
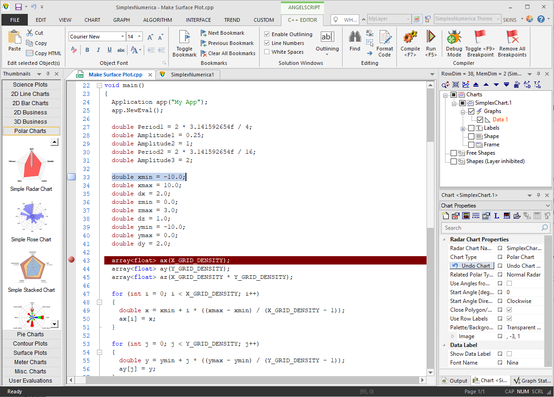
The inbuilt scripting languages of SimplexNumerica is based on AngelScript. AngelScript is a scripting library designed to allow applications to extend their functionality through internal and with the help of SimplexIPC to external scripts.
AngelScript is a scripting language with a syntax that's very similar to C++. It is a strictly typed language with many of the types being the same as in C++. Please have a look to the documentation. It will explain some concepts of how to use AngelScript in general, but a basic knowledge of the language will be needed to understand all of the concepts.
Combined Charts

In SimplexNumerica, we always can create charts comparing different types of data. There are several chart types we can use, such as column, bar, line, pie, scatter chart and so on.
Sometimes it's necessary to plot two or more sets of values to show multiple types of data, such as a column chart and a line graph. In this case, you can create a combination chart which is to combine two different charts to make one.
Fast Fourier Transform (FFT)

A fast Fourier transform is an algorithm that samples a signal over a period of time and divides it into its frequency components. These components are single sinusoidal oscillations at distinct frequencies each with their own amplitude and phase. {Wikipedia}
SimplexNumerica provides Signal Processing incl. FFT in a wide ranges of functionality. You can calc and draw all the informations you need with the help of the Ribbonbar Algorithm and the assosiated properties.
Digital Dashboard

Dashboards are an easy-to-digest view of an organization’s key performance indicators (KPI) that lets viewers spot decisions and act on opportunities quickly. So, while we like to look good, a dashboard that fails to communicate key messages in your business data is a waste of time, money and effort.
With SimplexNumerica it's really easy to place charts and shapes on a layered page. You can try a bulk of selection of dashboards with overview and detail views so that you can quickly review this and then look deeper only if you wish. If you create an overview, make sure you have everything that a manager needs to know to make decisions on this dashboard. If a crucial metric is only in a detailed view, it is likely to be overlooked.
GPX Module - Open Street Map (OSM)

The new GPX Module in SimplexNumerica can be used to import, edit and export *.gpx files.
You can put a Open Street Map (OSM) with waypoints & tracks behind a chart. These elements (track = polyline) are vector graphic objects in SimplexNumerica.
You can comfortable edit and manipulate your tracks, e.g. reverse a track, reducing track points, etc.
You can also search for a destination, go to a place at specific coordinates, etc.
We could extend these series of features endless, but we think you get an impression of the huge amount of features inside SimplexNumerica. Certainly, they are there, and also well documented, but no need to use all of them...
Please contact us if you would like more information or have a look at our comprehensive user documentation (see above) in *.pdf form.
Other Programs