
Chartdirector® Charts
Custom Line Charts
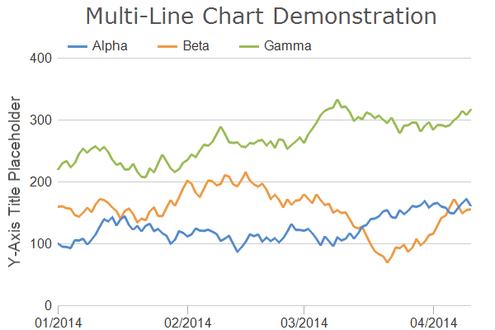
A simple line chart with multiple lines.
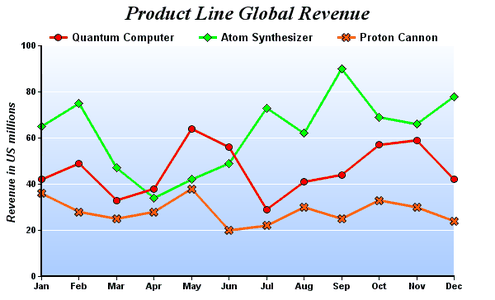
A line chart using different symbols for the data points, with a gradient colored background.
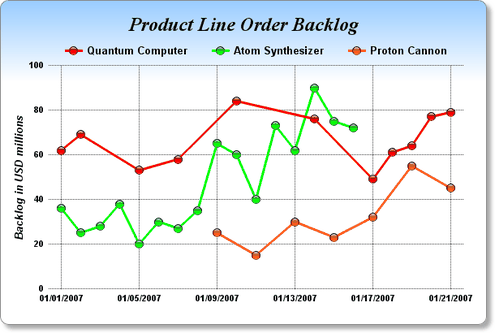
A line chart using glass spheres for the data points, with a gradient colored background and a soft drop shadow.
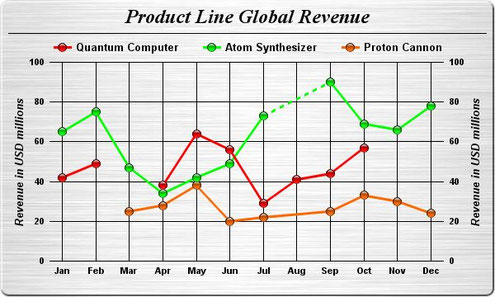
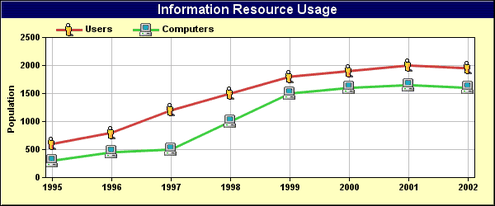
A line chart using glass spheres for the data points, with a brushed silver background.
Note that there are missing data points in this chart. In ChartDirector, missing data points can be represented as gaps in the line. Alternatively, the line can join through the missing data points using a different line style.
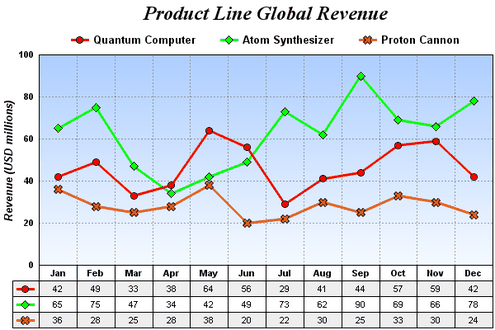
A line chart with a data table docked under the x-axis.
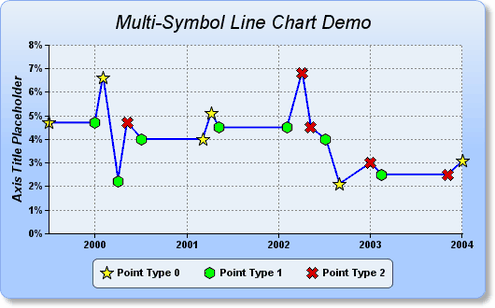
A line chart using different symbols for different data points on the same line.
A line chart with user-define custom symbols.
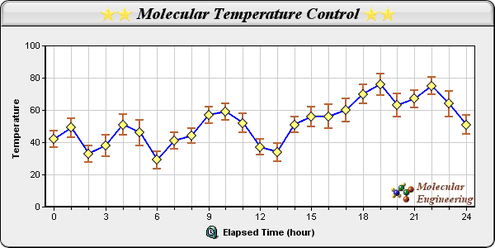
A line chart with 2 layers - a line layer for the line, and a box-whisker layer for the error symbols.
This chart demonstrates the power of ChartDirector's layering architecture. It allows one to combine arbitrary layers to create new chart styles using existing layer styles as building blocks.
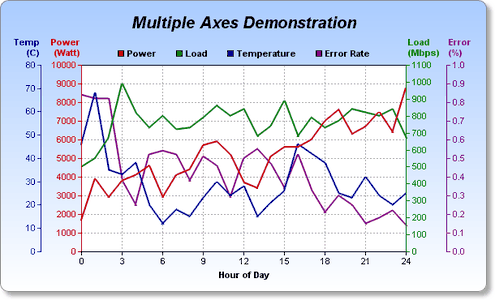
SimplexNumerica supports more axes per chart.
This example demontrates using 4 independent y-axes.
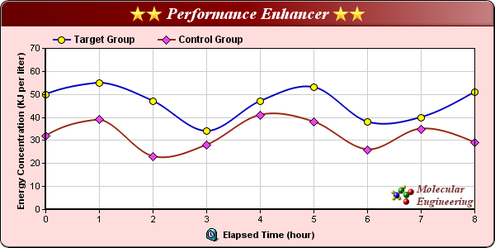
A spline line chart where the data points are joined by smooth spline curves instead of straight lines.
The chart title, axis title and the logo are created using ChartDirector Mark Up Language (CDML), so they can contain icons.
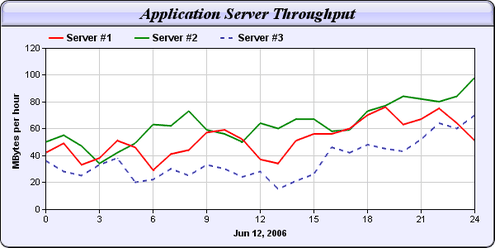
A multi-line chart demonstrating using dash line style for the lines.
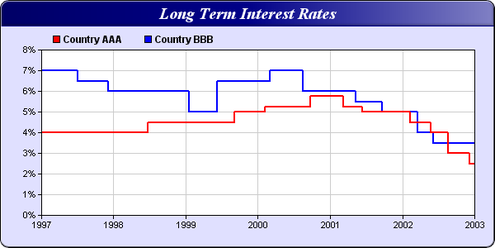
A step-line chart where the data points are connected by steps instead of straight lines.
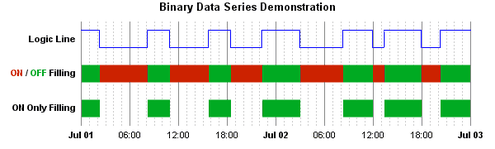
This chart is actually a step line chart showing 3 graphs. In graph, the data only have two possible values.
The ON/OFF filling in this chart is achieved by filling the regions under and above the step line with green and red. The step line itself is transparent and therefore invisible.
The ON only filling is similar to ON/OFF filling, except only the ON regions are filled.
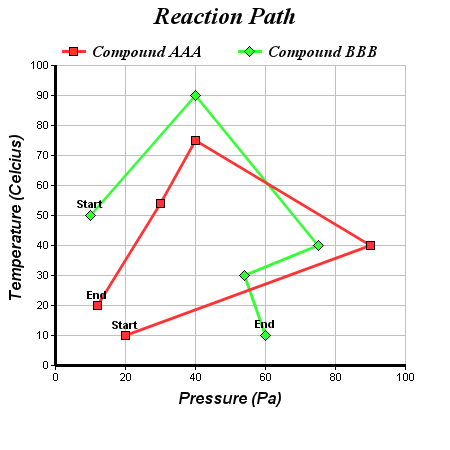
An arbitrary XY line chart. Demonstrates that in ChartDirector, line segments can flow in any arbitrary direction (not just left to right).
Custom data labels are used to mark the "Start" point and "End" point of each line.
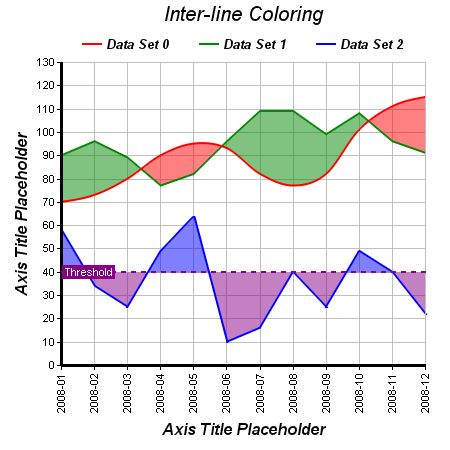
SimplexNumerica supports filling the region between two lines with interline layers. The lines can be straight lines, spline curves, step lines, trend lines or mark lines. The fill colors can be different depending on which line is on top.
This chart consists of a spline layer for the curve, a line layer for the two green lines, and three interline layers for the green, red and blue fillings.
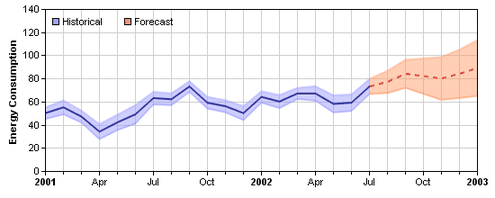
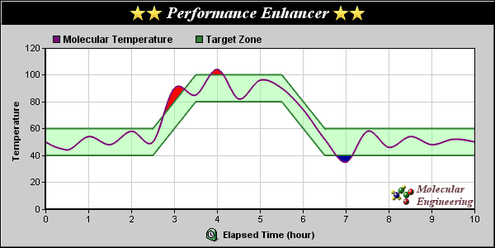
This chart demonstrates of a line surrounded by a variable zone. It is composed by using a line layer with an inter-line filling layer.
Both the line and the zone change styles when they reach a threshold position on the x-axis. This is achieved by using "zone colors".
Zone colors are colors that change abruptly at user-defined threshold positions. In this chart, the line changes from "solid blue" to "dash line red" upon reaching "x = Jul", while the fill color changes from light blue to light red.

This chart demonstrates ChartDirector's mark and zone feature. The red horizontal line and the brown vertical lines are mark lines. The orange region is a user defined zone.