SimplexNumerica User Interface
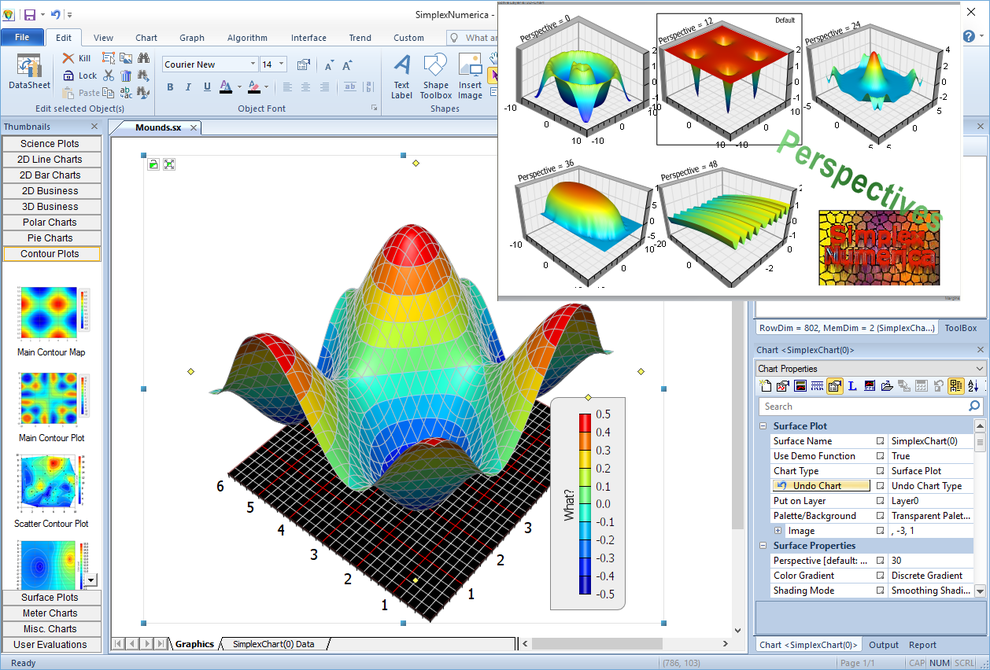
The SimplexNumerica Graphical User Interface (GUI) is completely new developed, as it shows in the next pictures. These examples show the different Ribbonbars, like Algorithm with an example Contour plot. To the left you will see the Thumbnail window which can be used to select e.g. a Surface Plot.
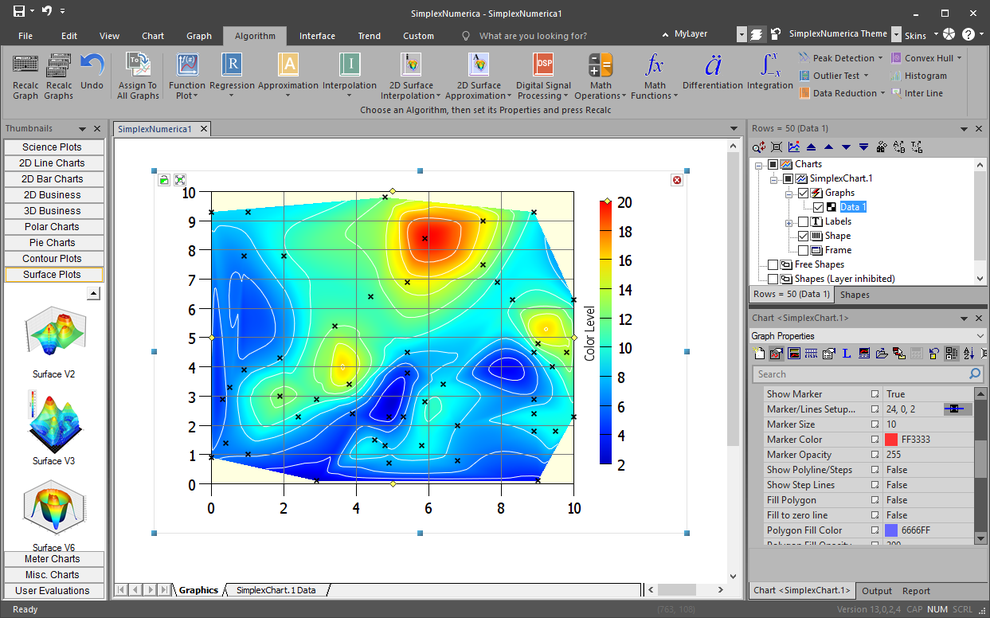
Next example has changed the mainframe skin to Microsoft Office blue and displays a High Resolution Contourplot. This specific render quality is absolutely amazing.
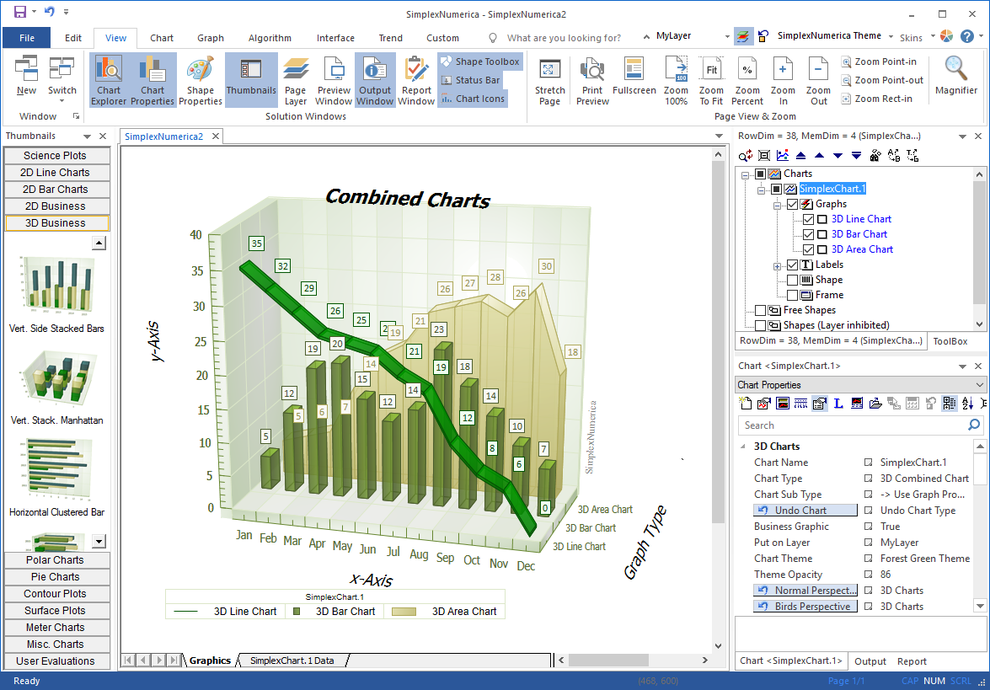
Following screendump has a Microsoft Office 2018 look & feel and a new Business 3D Vector Graphic Chart in its evaluation window.
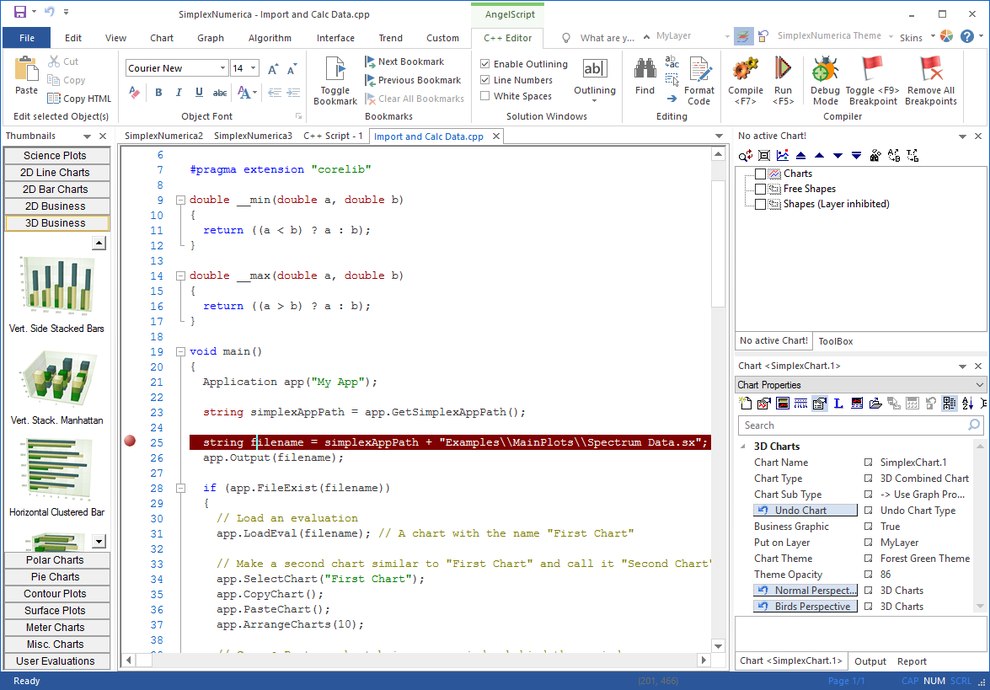
Here you can see a simple sample of the inbuilt AngelScript C++ language from SimplexNumerica. Remarkable the effectiv C++ Editor, integrated into the Ribbonbar mainframe of SimplexNumerica.
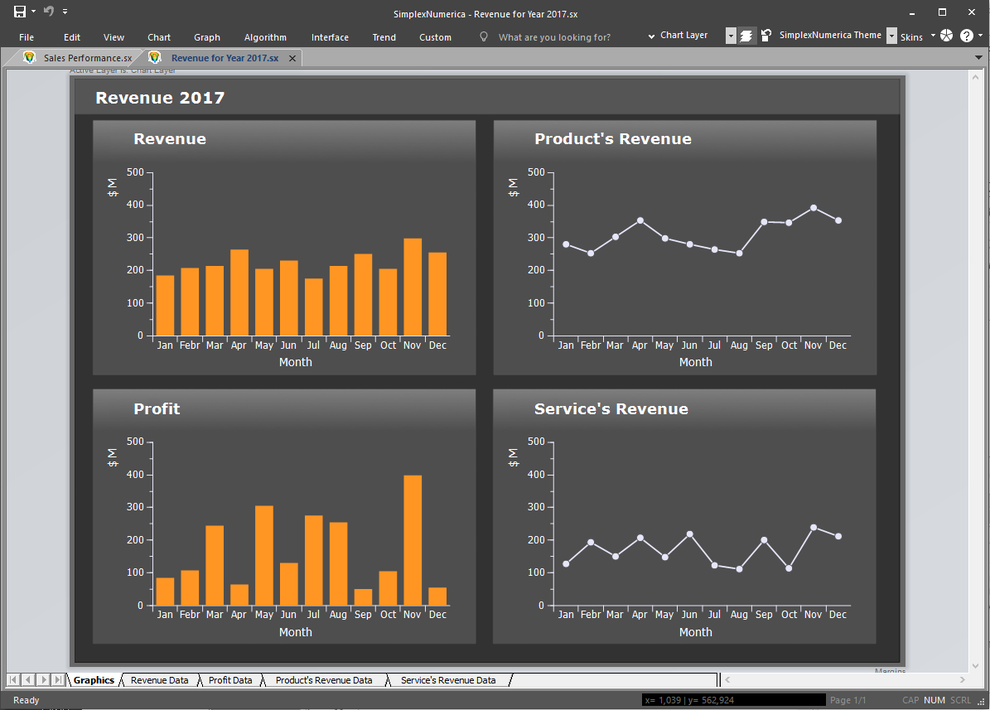
Dashboards are an easy-to-digest view of an organization’s key performance indicators (KPI) that lets viewers spot decisions and act on opportunities quickly.
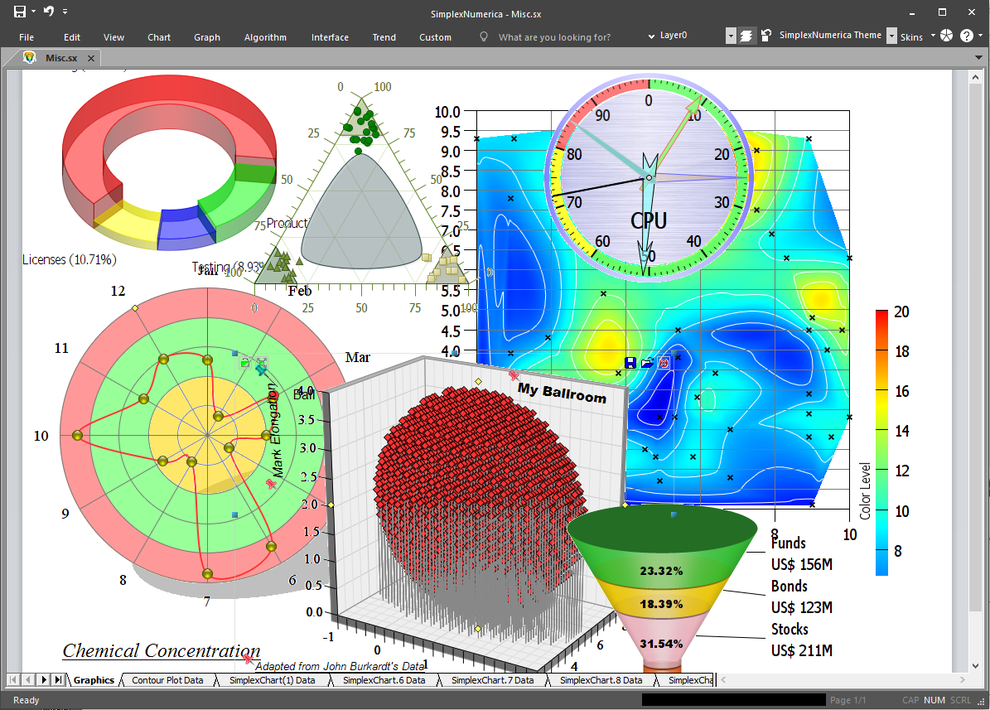
Certainly, you can put a gallimaufry, that means, everything together onto one page. You can act like a drawing program with shapes, charts, and gauges altogether. Here it makes sense to organize these on different layers in SimplexNumerica.
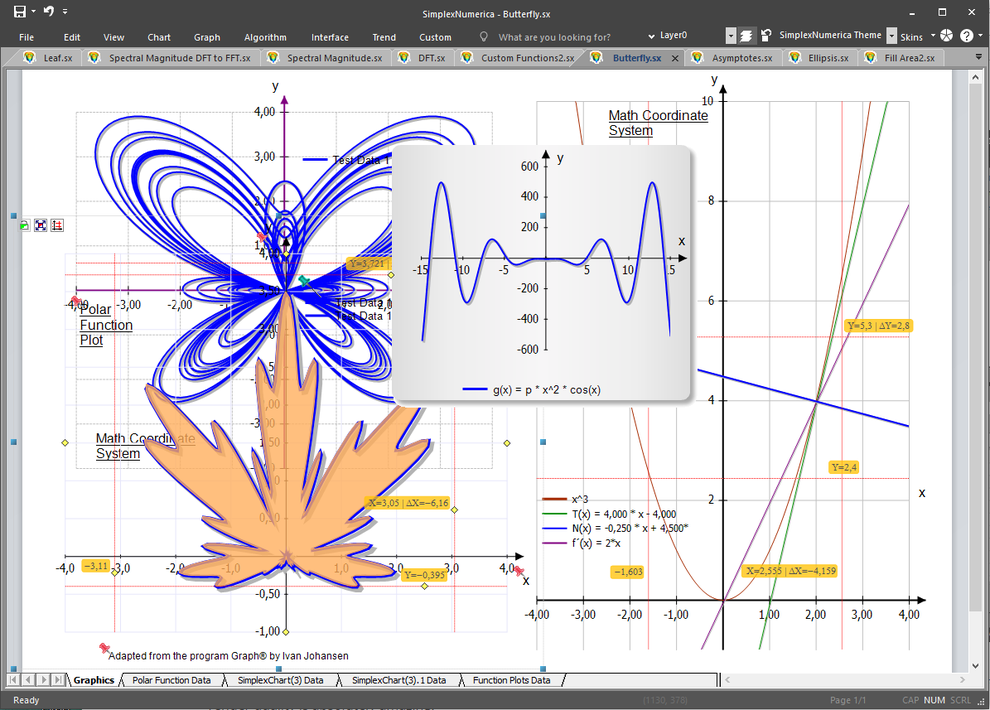
You can also put arbitrary function plots onto one page...
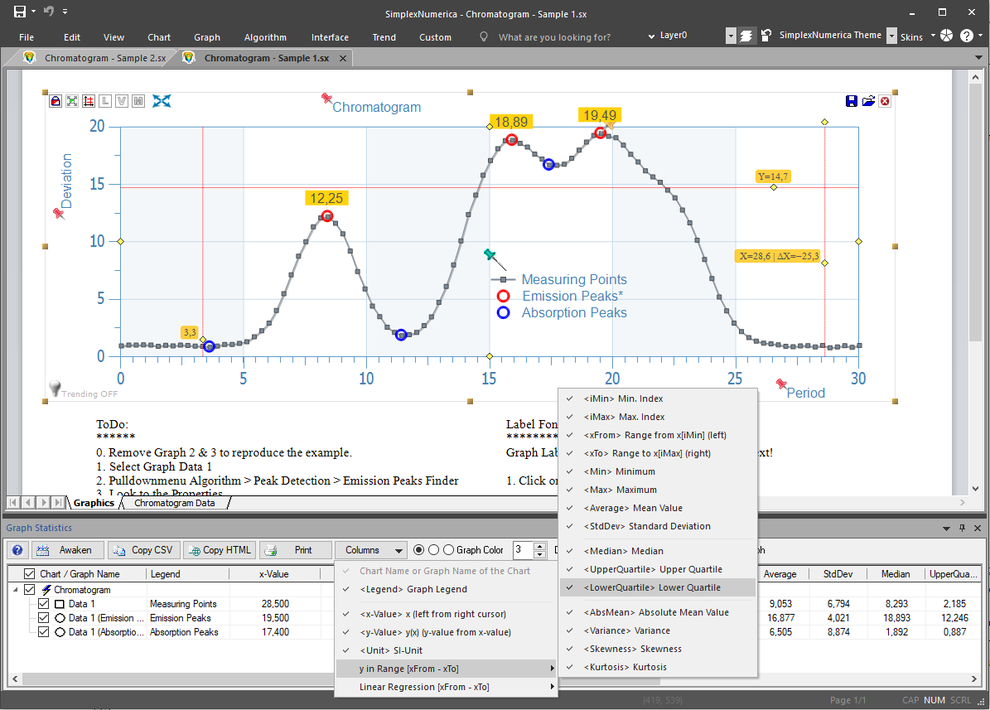
The Process Analyst
This arbitrary view allows Operators to display trend data (both real-time and historical) for comparison and analysis during run time. Users can configure certain properties of the Process Analyst also during design time.
A typical Process Analyst view might look like the one shown here. The peakfinder has been found the blue and red marks on the screen. The statistic window will display all relevant statistic value in a combined tree-table-control.