
CHARTDIRECTOR® CHARTS
Surface Plots
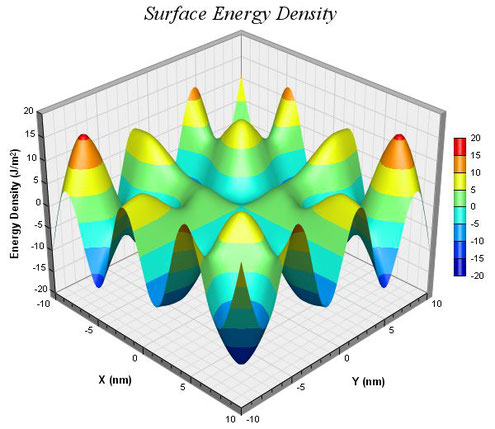
A surface chart with lighting effects. The smooth surface is created using spline surface fitting of the data points.
A surface chart with continuous coloring and lighting effects, and with white contour lines and grey grid lines. The smooth surface is created using spline surface fitting of the data points.

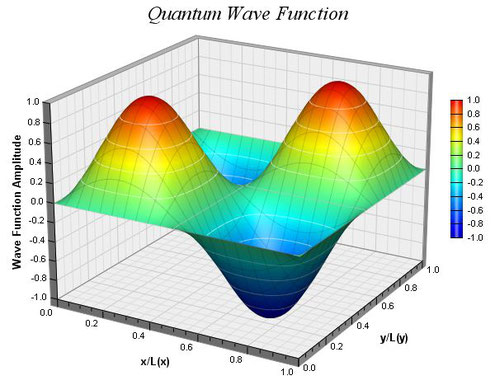
A surface with a deep perspective effect (things nearer are larger while things farther away are smaller).
Note that the grid lines has two styles. There are darker major grid lines and dashed minor grid lines.
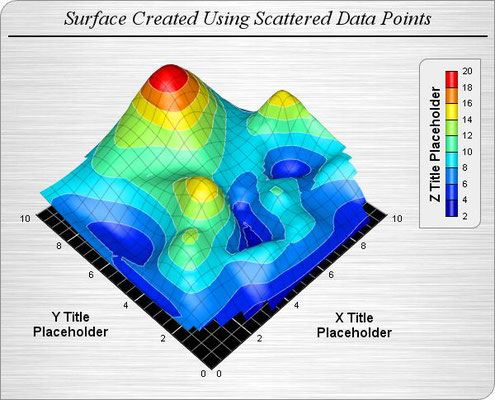
A surface chart created using scattered data (data points are randomly distributed rather than lying on a grid), with the vertical walls hidden.
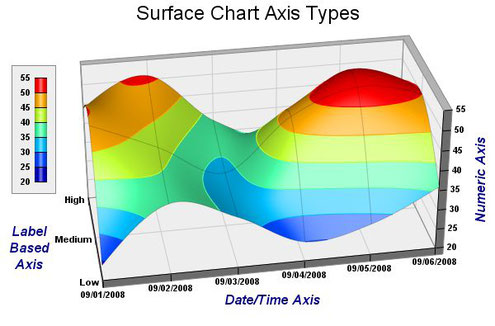
This chart illustrates the different axis types supported by ChartDirector - label based axis, date/time axis and numeric axis.