
Chartdirector® Charts
Area Charts
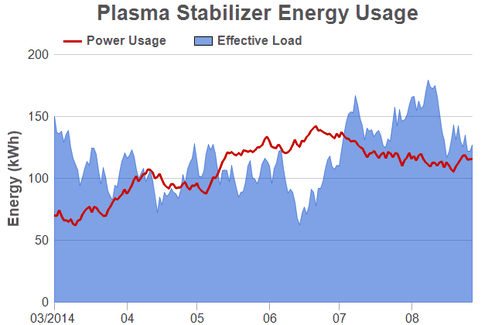
An area layer with a line layer on top. The area layer is semi-transparent so you can see the grid lines under it.
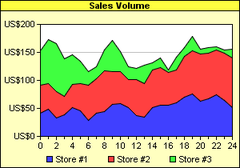
A 2D stacked area chart, with legends at the bottom of the chart.
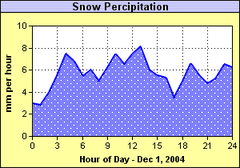
An area chart in which the area is filled with a pattern.

A 3D area chart using 3 area layers.
Semi-transparent colors ensure bottom layers remain visible.

A 3D stacked area chart.
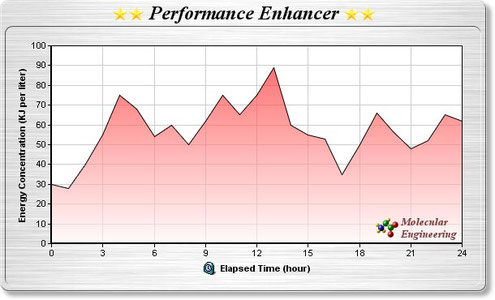
A nicely designed area chart, using semi-transparent gradient color for the area region, on a brushed silver frame with a soft drop shadow.
The chart title, axis title and logo are created using CDML, so they can contain icons.

A percentage area chart, in which the areas are automatically scaled so they always stacked up to 100%.
The legend keys are created using CDML, so they can contain icons.

An area chart demonstrating the zone color feature of SimplexNumerica.
Zone colors are colors that can change abruptly at user-defined threshold positions. In this chart, the area is filled with a zone color configured to change at y = 60.
The chart title, axis title and logo are created using CDML, so they can contain icons.
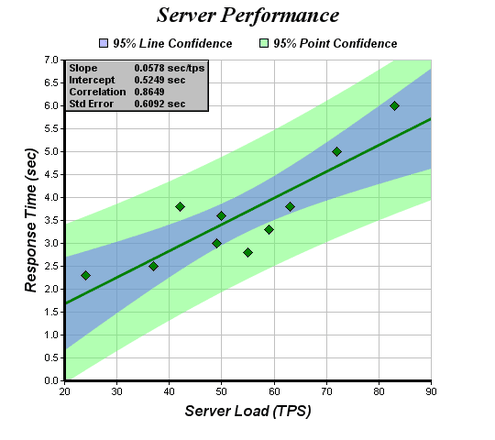
A chart containing a scatter layer and a trend layer, demonstrating linear regression with line and point confidence bands.
A custom text box is used on the top-left corner to display the regression parameters.