
Chartdirector® Charts
2D Scatter Plots
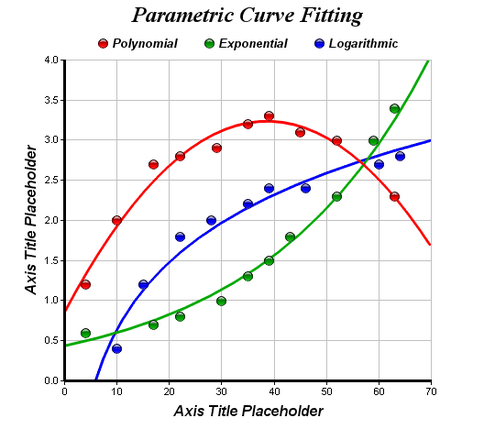
A chart containing 3 scatter layers and 3 trend layers, demonstrating polynomial, exponential as well as logarthmic regression.

A chart containing a line layer and a trend layer.
Note that the x-axis labels are rotated by 90 degrees so they can be packed more tightly.
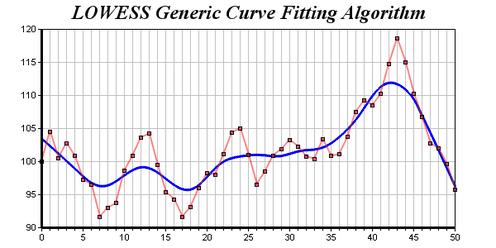
A chart with a line layer and a spline layer.
The spline line is computed using the LOWESS algorithm, which is a generic curve fitting algorithm supported by ChartDirector.
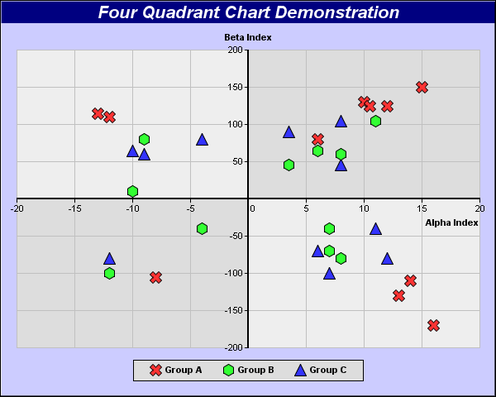
A scatter chart showing all 4 quadrants in the XY plane, with alternative background colors for the quadrants.
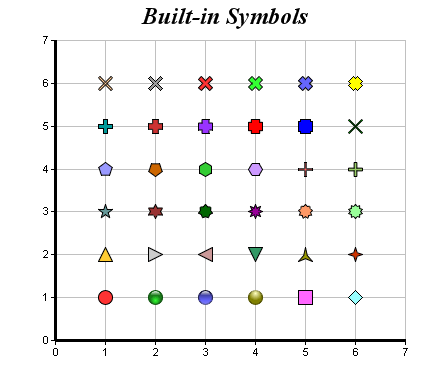
A scatter chart designed to demonstrate ChartDirector's rich set of built-in symbols.
Apart from built-in symbols, ChartDirector supports using arbitrary polygons (including concave polygons like the star shape) and custom images as symbols.
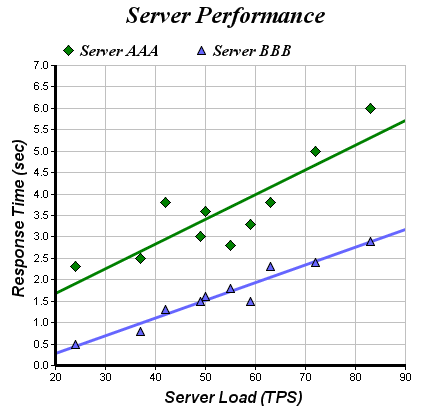
A scatter chart with trend lines.
This chart is created as 4 layers - 2 scatter layers and 2 trend line layers.
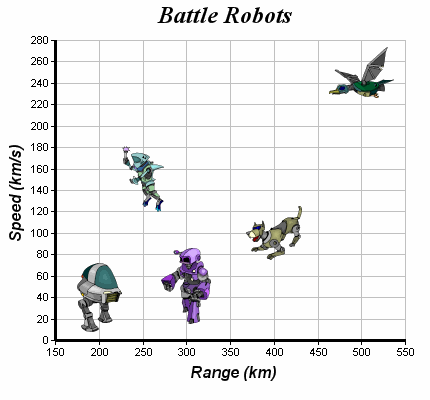
A scatter chart using custom images as symbols.
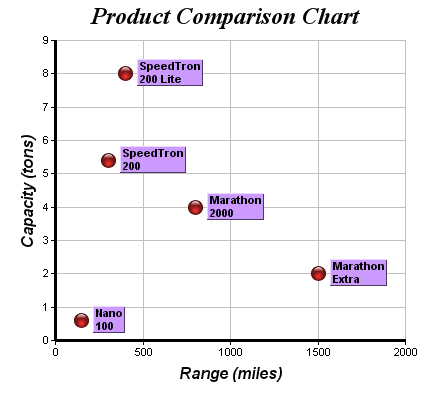
A scatter chart with a custom data label at every point.