Simplexety provides many techniques for plotting functions. Graphical capabilities of Simplexety include graphic manipulation and zooming tools, and exporting graphics to standard picture formats. You can also plot symbolic deviations.
ToDo:
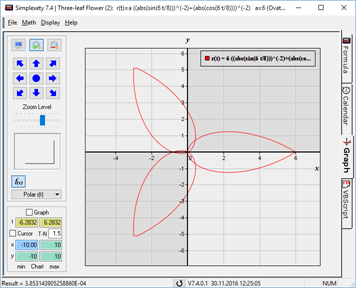
Expression Line, using x as the function argument and put in the x- and y-limits for the graph range. Then click on [Graph] in the Panel for displaying the graph.
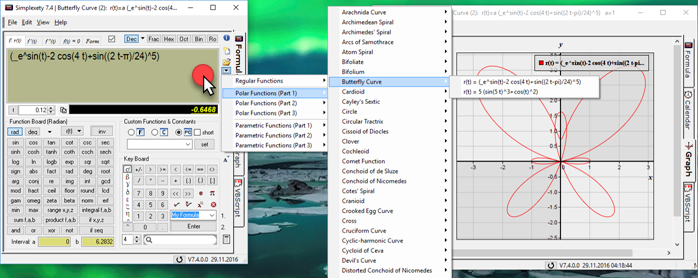
sample Plots
Todo:
Use that small icon (underneath the open icon) to open a popup menu with all the sample functions!