

Language switchable between English, French and German
»One of the best scientific graphics & numerical data Tools worldwide«
Developed by Dipl.-Phys.-Ing. Ralf Wirtz
The SimplexNumerica package contains the following programs (also for free, get it from here):

»Data Visualization optimized for Microsoft Windows 10/11«
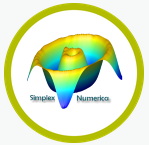
SimplexNumerica is a data analysis and graphing software that can be used to visualize and analyze data sets. It has a number of features and tools for data analysis, including data manipulation, data plotting, data fitting, and statistical analysis. It also supports the import of various data formats, such as database, spreadsheet and text files. With SimplexNumerica, you can create custom data visualizations, analyze data using statistical methods, and export the results to various formats. In addition, the software can be used to create attractive charts, graphs and diagrams.
SimplexNumerica has been designed to make complicated numerical math applied to big data analysis very simple, in conjunction with an outstanding chart library. The evaluation of your measurement data will be simplified, enormously.
If you have any questions, please do not hesitate to contact us.
>>> Download and view the Documentation here!

»numerical analysis Of BIG DATA made simple«
SimplexNumerica is a comprehensive and powerful application that can be used in order to analyze data, 2D and 3D plotting, make complex calculations and develop programs in the C++ scripting language. The GUI you are met with has a state-of-the-art Microsoft Office 2016 design with a lot of skins which you can use.
You should know that the comprehensive and well-drawn documentation plus multiple examples at your fingertips and many supported extensions might aid beginners in finding their way around SimplexNumerica.
First and foremost, you should know that this program comes packed with a pretty large number of sample scripts and examples for many of its options, including function plots, graph plots, math functions, histograms and IIR filters. These enable you to learn how to get around the tool much faster.
Data can be imported from formats such as CSV, XLS, XLSX, DBF, MDB and multiple server databases, while export is available only using CSV and XLS extensions. Projects can be saved to a custom location as a SXW and SX files, so that you work on them at a later date.
Add plots, charts and algorithms
It is possible to build multiple types of plots and charts (e.g. science plots, bar charts, pie charts, contour plots, meter charts etc.), as well as view all the items it contains and its properties in dedicated panes. A wide range of algorithms can be accessed, including interpolation, approximation, function plot, data reduction, outlier test and math operations and functions.
A few incorporated scripting options
When it comes to C++ scripting, you should know that it is possible to work with CPP files, add bookmarks and toggle them, insert and remove breakpoints, enable outlining and line numbers so that you can keep better track of what you write, as well as run, compile and debug your code.
A final assessment
The system’s performance might be affected from time to time by SimplexNumerica, yet this is to be expected seeing how complex the app is. The response time is good and we did not come across any issues such as bugs, hangs or freezes.
Taking all of this into consideration, it is safe to say that this piece of software is useful and efficient, and comprises a long list of options which can keep you busy for quite a while. The interface is now extremely intuitive, yet it compensates with the tutorials and other related documentation it comprises, too.
SimplexNumerica was reviewed by Madalina Boboc, Softpedia
http://www.softpedia.com/get/Programming/Components-Libraries/SimplexNumerica.shtml


Topics:
Curve Fitting, Data Analyzer, Numerical Mathematics, Diagram, Plotting, Chart, Graph, Plotting Scientific Graphs, Plot Program, Scientific Graphics, Scientific Graphing, Data Analysis, Data Analytics, Data Science, Process Visualisation, Data Plot, 3D Plot, Box Plot, Scatter Plot, Whisker Plot, Times Series, Histogram, Linear Regression, Cubic Splines, Contour Plot, Surface Plot, Polar Charts, Mahattan Bar Charts, 3D Plot Software, 3D Graphing Software, Mathematical Graph Drawing Software, Scientific Graphing Software, Software to draw graphs, Gnuplot, Free graph plotting software, Best graph software, Mathematical graph drawing software